Phiala Thouvenin, Ph.D.'s Portfolio
Coding Projects and Examples
Image Surface Tracking
- For analog tectonic models, the position of the surface is of the utmost importance
- From this surface, we can calculate quantities like particle depth, surface slope, deformation front postion, among others
Module Imports
import pandas as pd
import numpy as np
import matplotlib.pyplot as plt
import pims
images = pims.ImageSequence('data/*.jpg')
xmin,xmax,ymin,ymax = 95, 5095,300, 1290 # pixel boundaries of image crop
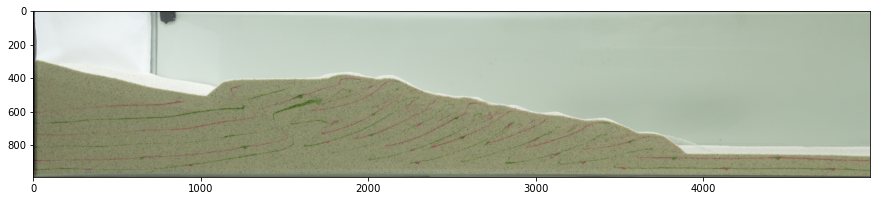
Model Images
plt.figure(figsize=(15,5))
plt.imshow(images[0][ymin:ymax,xmin:xmax,:] )
<matplotlib.image.AxesImage at 0x1ef009968b0>
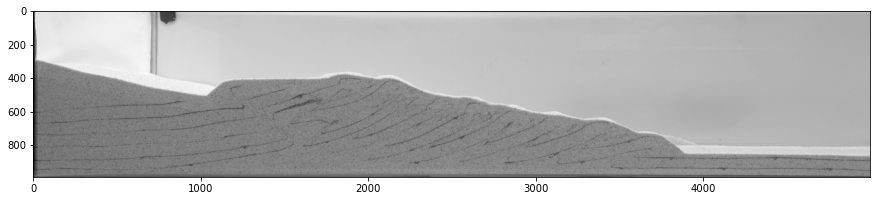
Surface Tracking Function
Extract surface by:
- Converting to grayscale
- Use a bimodal image thresholding technique (such as Otsu’s method (1979)) to separate foreground from background (note the small holes towards the front of the wedge)
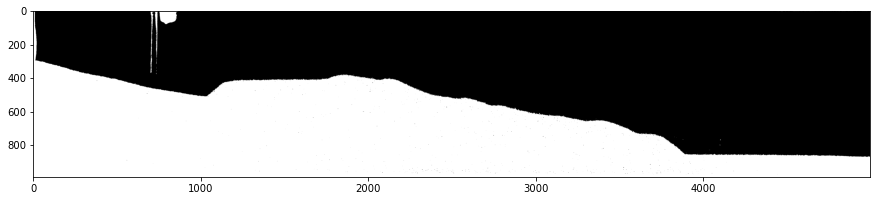
- Using pixel labeling (Jain 1989), fill in the foreground mask to plug holes

- Use Sobel edge detection on resulting mask and identify border between foreground and background as the surface
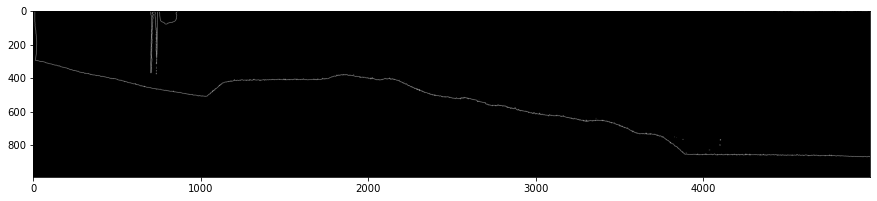
def subsel_surface_generator_nocv(images,hdf_storename,
                                  xmin,xmax,ymin,ymax,
                                  surf_cutoff = 15,
                                  from_larger=False, plate=False,
                                  medwindow=31):
    '''
    Calculate wedge surface location for an entire wedge experiment, without
        using OpenCV, as it can be difficult to install on some systems,
        and with all required functionality handled by skimage, scipy
        and pandas

    Parameters
    ----------
    images : list
        List of images to analize.
    hdf_storename : str
        Hdf5 file to store surface data, with keys of format 'wedgetop_*****.
    from_larger : bool, optional
        WHether or not the surface should be taken from larger image.
        The default is False.

    Returns
    -------
    None.

    '''
    st = pd.HDFStore(hdf_storename)
    for i,im in enumerate(images):
        # greyscale of original image
        if type(images) == pims.image_sequence.ImageSequence:
            if im.shape[-1] == 4: #RGBA
                basic_grey = color.rgb2gray(np.asarray(im)[:,:,:-1])
            else: #RGB
                basic_grey = color.rgb2gray(np.asarray(im))
        else:
            im = io.imread(im)
            if im.shape[-1] == 4: #RGBA
                basic_grey = color.rgb2gray(im[:,:,:-1])
            else: #RGB
                basic_grey = color.rgb2gray(im)
        # crop from larger image (most are)
        if from_larger:
            orig_h = basic_grey.shape[0]
            basic_grey = basic_grey[ymin:ymax,xmin:xmax]

        # Otsu (1979) thresholding to get histogram threshold value
        thresh = filters.threshold_otsu(basic_grey)
        threshed = basic_grey<thresh

        # fill in any holes, no matter how small, via labeling (Jain, 1989)
        labels = measure.label(threshed)
        labelCount = np.bincount(labels.ravel())
        background = np.argmax(labelCount)
        threshed[labels != background] = 1
        sure_bg_filled = binary_fill_holes(threshed).astype(np.uint8)

        # sobel edge detection
        edge = filters.sobel(sure_bg_filled)

        # extract surface from detected edge
        surf = []
        for j in range(edge.shape[1]):
            if len(edge[:,j][edge[:,j] > 0]):
                bottom = np.nonzero(edge[:,j])[0][-1]
                surf.append([j,edge.shape[0]-bottom])
        surf = pd.DataFrame(surf,columns=('x','y'))
        # delete points that are within wedge
        surf.y[surf.y.diff().abs() > surf_cutoff] = np.nan
        # adjustable median filter window to remove errant points in surface
        surf.y = medfilt(surf.y,medwindow)
        # correct coordinates to cropped version
        if from_larger:
            surf.x = surf.x + xmin
            surf.y = surf.y + (orig_h-ymax)
        # save surf, as int16 as we're dealing with pixel edges (save space)
        surf_xy = np.vstack((surf.x,surf.y)).astype(np.int16)
        st.put('wedgetop_%05.0f'%i,pd.DataFrame(surf_xy.T,columns=('x','y')))
        print(r'Calculated surface of image # %05.0f'%(i))
    st.close()
Run Script
run src/main.py
Calculated surface of image # 00000
Calculated surface of image # 00001
Calculated surface of image # 00002
Calculated surface of image # 00003
Calculated surface of image # 00004
Calculated surface of image # 00005
Calculated surface of image # 00006
Calculated surface of image # 00007
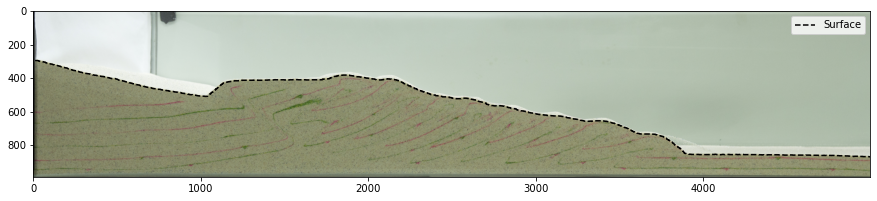
Plot Surfaces
- Determine of algorithm worked correctly
surf = pd.read_hdf('pjt_slope15_prebuilt_062218_surfnocv_2023.h5', 'wedgetop_00001')
plt.figure(figsize=(15,5))
plt.imshow(images[0][ymin:ymax,xmin:xmax,:])
plt.plot(surf.x-xmin,(images.frame_shape[0])-surf.y-ymin, 'k--')
plt.legend(['Surface'])
<matplotlib.legend.Legend at 0x1ef065e9f70>